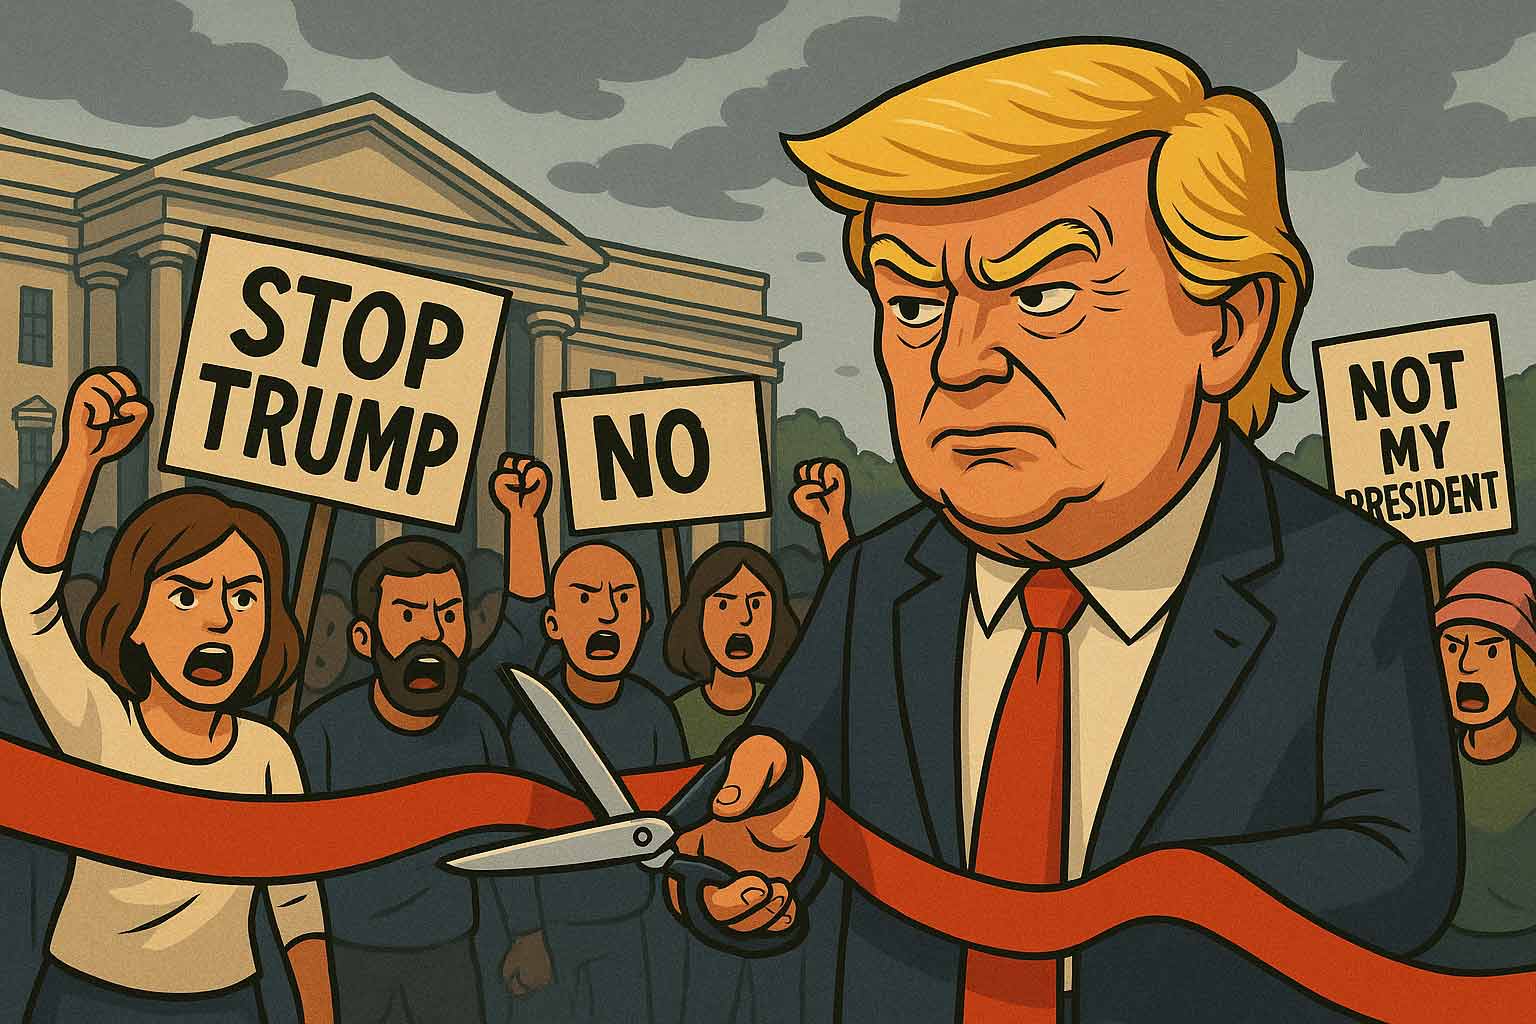
The Numbers Behind the Firings: Why 2025’s Federal Layoffs Aren’t as Massive as They Seem
When headlines announced that thousands of federal workers were being fired across Washington, the reaction was immediate — shock, frustration, and fear of a government hollowed out from within. But a closer look at the data tells a more nuanced story: while the total number of layoffs in 2025 is historically significant, the percentage of employees dismissed from most agencies remains relatively small.
A Story of Scale: Thousands vs. Millions
The U.S. federal government employs roughly 2.2 million civilians. Against that backdrop, even headline-grabbing figures — like 10,000 firings at USAID or 7,000 at the IRS — translate to just fractions of total federal employment.
In percentage terms, most agencies saw staff reductions between 1% and 5%. A handful of departments such as USAID (~85%) and the Consumer Financial Protection Bureau (~20%) were clear exceptions, but these agencies are relatively small compared to giants like the Department of Defense or Treasury.
The result? A sweeping narrative of federal upheaval that, in percentage perspective, resembles more of a strategic reshuffling than an across-the-board purge.
Which Agencies Were Affected
| Agency / Unit | Approximate # Fired | % of Agency Workforce | Notes / Context |
|---|---|---|---|
| USAID | ~10,000 | ~85% | Nearly entire direct-hire staff dismissed; only a few hundred retained. Wikipedia |
| Consumer Financial Protection Bureau (CFPB) | ~1,500 | ~20% | Major reduction of term and temp workers. Wikipedia |
| USDA (Agriculture Department) | ~5,600 | ~11% | Cuts across research, conservation, and headquarters roles. Wikipedia |
| Department of the Interior / Bureau of Land Management (BLM) | ~2,300 | ~7% | Included ~800 BLM staff. Wikipedia |
| U.S. Forest Service (USFS) | ~3,400 | ~6% | Probationary and non-career employees terminated. Wikipedia |
| Centers for Disease Control and Prevention (CDC) | ~1,300 | ~5% | Disease surveillance and reporting staff fired; some rehired later. The Guardian |
| National Park Service (NPS) | ~1,000 | ~4% | Operations and maintenance roles cut nationwide. Wikipedia |
| Internal Revenue Service (IRS) | ~6,000–7,000 | ~4% | Probationary and processing staff terminated. Wikipedia |
| National Institutes of Health (NIH) | ~1,200 | ~3% | Research and administrative staff reduced. Wikipedia |
| Department of Energy / NNSA | ~1,200 | ~3% | Included National Nuclear Security Administration positions. Wikipedia |
| Department of State (including Foreign Service) | ~1,300 | ~2% | Mid-year dismissals of civil and foreign service employees. Wikipedia |
| Bonneville Power Administration (BPA) | ~400 | ~2% | Staff cuts within the Department of Energy. Wikipedia |
| Department of Defense (civilian staff) | ~5,400 | ~1.5% | Non-career and probationary workers affected. Wikipedia |
| Federal Aviation Administration (FAA) | ~400 | ~1% | Support staff reductions; air-traffic controllers unaffected. Wikipedia |
| Inspectors General (various agencies) | 17 | <1% | 17 federal Inspectors General were dismissed in January; some terminations ruled unlawful. Wikipedia |
| Other agencies (EPA, HUD, DHS, GSA, FEMA, CISA, etc.) | Various | N/A | Scattered smaller layoffs and contract terminations. Wikipedia |
| Shutdown-related terminations (October 2025) | 4,108 | ~0.2% (federal total) | Across HHS, Treasury, HUD, CDC, and more during the 2025 shutdown. Reuters |
Most others — from the Department of State to the National Park Service — saw changes that, while disruptive internally, represented no more than a few percentage points of total employment.
Legal and Political Context
Many of these firings occurred under the 2025 government reorganization drive and the October shutdown, a period when the administration aimed to reduce “bureaucratic inefficiencies” and align staff structures with policy priorities.
However, the strategy has faced legal and public scrutiny.
Federal judges temporarily halted parts of the shutdown-era dismissals, arguing that mass firings exceeded executive authority and may have violated due process protections. Agencies like the CDC and HHS have already reversed or delayed several layoffs as a result.
Optics vs. Impact
The optics of thousands of federal workers losing their jobs carry political weight — but the statistical impact across government operations is less dramatic.
For example:
-
4,108 terminations during the October 2025 shutdown represented less than 0.2% of total federal employment.
-
The Department of Defense, the largest employer in the federal system, cut about 1.5% of its civilian workforce — a sizable number in raw terms, but minimal operationally.
-
Even the IRS, long a focus of debate over staffing levels, saw less than a 4% reduction.
In other words, while the layoffs signal a shift in priorities, they do not amount to the widespread dismantling that many headlines implied.
What It Means for the Future
The real question isn’t just how many people were fired, but which positions were affected. Early analyses suggest that technical, research, and oversight roles — particularly within scientific and regulatory bodies — bore the brunt of reductions.
That selective targeting could have long-term consequences, especially if expertise in public health, environmental monitoring, or fiscal oversight takes years to rebuild.
But from a purely statistical view, the data paints a less sensational picture: the 2025 federal layoffs, while headline-worthy, represent modest percentage changes across most agencies rather than a wholesale downsizing of government.
